A) low,so there was upward pressure on wages and prices.
B) low,so there was downward pressure on wages and prices.
C) high,so there was upward pressure on wages and prices.
D) high,so there was downward pressure on wages and prices.
F) A) and C)
Correct Answer

verified
A
Correct Answer
verified
Multiple Choice
Figure 35-1.The left-hand graph shows a short-run aggregate-supply (SRAS) curve and two aggregate-demand (AD) curves.On the right-hand diagram,U represents the unemployment rate. 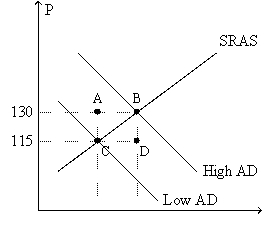
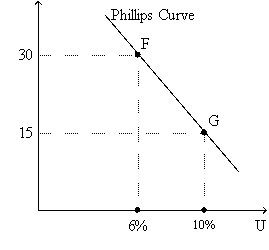 -Refer to Figure 35-1.Suppose points F and G on the right-hand graph represent two possible outcomes for an imaginary economy in the year 2012,and those two points correspond to points B and C,respectively,on the left-hand graph.Also suppose we know that the price index equaled 120 in 2011.Then the numbers 115 and 130 on the vertical axis of the left-hand graph would have to be replaced by
A) 155 and 175,respectively.
B) 138 and 156,respectively.
C) 137.5 and 154.75,respectively.
D) 135 and 150,respectively.
F) C) and D)
Correct Answer

verified
Correct Answer
verified
Multiple Choice
The theory by which people optimally use all available information when forecasting the future is known as
A) rational expectations.
B) perfect expectations.
C) credible expectations.
D) predictive expectations.
F) All of the above
Correct Answer

verified
Correct Answer
verified
Multiple Choice
For a number of years Canada and many European countries have had higher average unemployment rates than the United States.The Phillips suggests that these countries
A) have higher average inflation rates than the United States.
B) have long-run Phillips curves to the right of the United States'.
C) may have less generous unemployment compensation or lower minimum wages.
D) All of the above are consistent with the evidence on unemployment rates.
F) B) and C)
Correct Answer

verified
Correct Answer
verified
True/False
In most of the 1970s,the Fed's policy created expectations of high inflation.
B) False
Correct Answer

verified
Correct Answer
verified
Multiple Choice
The long-run Phillips curve would shift left if
A) the money supply increased or if the minimum wage was reduced.
B) the money supply increased but not if the minimum wage was reduced.
C) the minimum wage was reduced but not if the money supply increased.
D) None of the above is correct.
F) A) and C)
Correct Answer

verified
Correct Answer
verified
Multiple Choice
In 1968,economist Milton Friedman published a paper criticizing the Phillips curve on the grounds that
A) it seemed to work for wages but not for inflation.
B) monetary policy was ineffective in combating inflation.
C) the Phillips curve did not apply in the long run.
D) Phillips had made errors in collecting his data.
F) C) and D)
Correct Answer

verified
C
Correct Answer
verified
Multiple Choice
Figure The Economy in 2008 In the first half of June 2008 the effects of a housing and financial crisis and an increase in world prices of oil and foodstuffs were impacting the economy. -Refer to The Economy in 2008.The short-run effects of rising world commodity are shown by
A) moving to the right along the short-run Phillips curve.
B) moving to the left along the short-run Phillips curve.
C) shifting the short-run Phillips curve right.
D) shifting the short-run Phillips curve left.
F) B) and C)
Correct Answer

verified
Correct Answer
verified
Multiple Choice
Suppose the central bank pursues an unexpectedly expansionary monetary policy.In the short-run the effects of this are shown by
A) moving to the left along the short-run Phillips curve.
B) moving to the right along the short-run Phillips curve.
C) shifting the short run Phillips curve right.
D) shifting the short run Phillips curve left.
F) A) and C)
Correct Answer

verified
A
Correct Answer
verified
Multiple Choice
A policy that raised the natural rate of unemployment would shift
A) both the short-run and the long-run Phillips curves to the right.
B) the short-run Phillips curve right but leave the long-run Phillips curve unchanged.
C) the long-run Phillips curve right but leave the short-run Phillips curve unchanged.
D) neither the long-run Phillips curve nor the short-run Phillips curve right.
F) All of the above
Correct Answer

verified
Correct Answer
verified
Multiple Choice
How would a decrease in the natural rate of unemployment affect the long-run Phillips curve?
A) It would shift the long-run Phillips curve right.
B) It would shift the long-run Phillips curve left.
C) There would be an upward movement along a given long-run Phillips curve.
D) There would be a downward movement along a given long-run Philips curve.
F) A) and C)
Correct Answer

verified
Correct Answer
verified
Multiple Choice
Unemployment would decrease and prices increase if
A) aggregate demand shifted right.
B) aggregate demand shifted left.
C) aggregate supply shifted right.
D) aggregate supply shifted left.
F) A) and C)
Correct Answer

verified
Correct Answer
verified
Multiple Choice
If a central bank increases the money supply in response to an adverse supply shock,which of the following does its action move back closer to its value before the shock?
A) both the price level and output
B) the price level but not output
C) output but not the price level
D) neither output nor the price level
F) None of the above
Correct Answer

verified
Correct Answer
verified
True/False
Proponents of rational expectations argue that failing to account for peoples' revised inflation expectations led to estimates of the sacrifice ratio that were too high.
B) False
Correct Answer

verified
Correct Answer
verified
Multiple Choice
Refer to Monetary Policy in Southland.Suppose that the Southland Department of Finance undertakes a public relations campaign to convince people that they will soon change monetary policy to reduce inflation to 12.5%.If Southlanders believe their government then which,if any,curve(s) shift left?
A) the short-run and the long-run Phillips curve
B) the short-run but not the long run Phillips curve
C) the long-run but not the short-run Phillips curve
D) neither the short-run nor the long-run Phillips curve
F) All of the above
Correct Answer

verified
Correct Answer
verified
Multiple Choice
A movement to the right along a given short-run Phillips curve could be caused by
A) an increase in the natural rate of unemployment or expansionary monetary policy.
B) expansionary monetary policy,but not an increase in the natural rate of unemployment.
C) an increase in the natural rate of unemployment or a contractionary monetary policy.
D) contractionary monetary policy,but not an increase in the natural rate of unemployment.
F) B) and D)
Correct Answer

verified
Correct Answer
verified
Multiple Choice
In the short run,policy that changes aggregate demand changes
A) both unemployment and the price level.
B) neither unemployment nor the price level.
C) only unemployment.
D) only the price level.
F) A) and B)
Correct Answer

verified
Correct Answer
verified
Multiple Choice
Figure 35-2
Use the pair of diagrams below to answer the following questions. 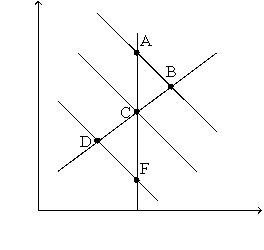
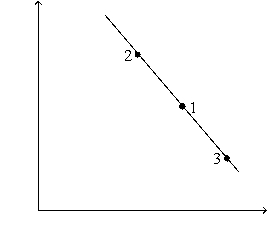 -Refer to Figure 35-2.If the economy starts at C and 1,then in the short run,an increase in taxes moves the economy to
A) B and 2.
B) D and 3.
C) E and 2.
D) None of the above is correct.
F) A) and B)
Correct Answer

verified
Correct Answer
verified
Multiple Choice
A change in expected inflation shifts
A) the short-run Phillips curve,but not the long run Phillips curve.
B) the long-run Phillips curve,but not the long run Phillips curve.
C) neither the short-run nor the long-run Phillips curve.
D) both the short-run and long-run Phillips curve right.
F) A) and B)
Correct Answer

verified
Correct Answer
verified
Multiple Choice
Figure 35-3 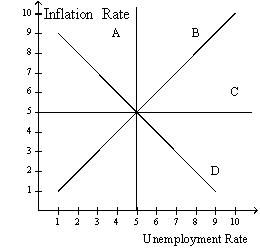 Refer to figure 35-3.In this order,which curve is a long-run Phillips curve and which is a short-run Phillips curve?
a.
A,B
b.
A,D
c.
C,B
d.
None of the above is correct.
ANS: B DIF: 1 REF: 35-2 NAT: Analytic
LOC: Unemployment and inflation TOP: Short-run Phillips curve | Long-run Phillips curve
MSC: Definitional
-Which of the following is vertical?
A) both the long-run Phillips curve and the long-run aggregate supply curve
B) neither the long-run Phillips curve nor the long-run aggregate supply curve.
C) the long-run Phillips curve,but not the long-run aggregate supply curve
D) the long-run Phillips curve,but not the long-run aggregate supply curve.
F) A) and B)
Correct Answer

verified
Correct Answer
verified
Showing 1 - 20 of 306
Related Exams